Electronic waste in India

Electronic waste

in India

A systems study of a crisis hiding in plain sight

A systems study of a crisis hiding in plain sight

India is the world's third largest e-waste generator, yet most of it disappears into an informal sector that recycles without regulation, safety, or accountability. This is a systems design study of why and where design can intervene.

India is the world's third largest e-waste generator, yet most of it disappears into an informal sector that recycles without regulation, safety, or accountability. This is a systems design study of why and where design can intervene.

Systems Thinking

Policy Design

Designing for Future

Design & Poetry

Artwork credit: Lalitya Krishnan | Tool: Procreate

Institution

Institution

NID Bengaluru

NID Bengaluru

Project Type

Project Type

Systems thinking

Systems thinking

Duration

Duration

10 Weeks | 2022

10 Weeks | 2022

Faculty Mentor

Faculty Mentor

Mr. Balaji Rengarajan

Mr. Balaji Rengarajan

Target Audience

Target Audience

EEE Indian Users

EEE Indian Users

*Electronics & Electrical Equipment

Electronic goods and increased digital connectivity drive global development, supporting everything from education and healthcare to the 17 SDGs. This reliance has only intensified recently, as the pandemic permanently accelerated the global shift toward digitalization in business and daily life.

Electronic goods and increased digital connectivity drive global development, supporting everything from education and healthcare to the 17 SDGs. This reliance has only intensified recently, as the pandemic permanently accelerated the global shift toward digitalization in business and daily life.

However, the current lifecycle of electronics is highly unsustainable, demanding a major systemic reboot. The world now generates approximately 50 million tonnes of e-waste annually, yet only 20% is formally recycled. If production, consumption, and disposal habits remain unchanged, this waste is projected to more than double to 120 million tonnes per year by 2050.

However, the current lifecycle of electronics is highly unsustainable, demanding a major systemic reboot. The world now generates approximately 50 million tonnes of e-waste annually, yet only 20% is formally recycled. If production, consumption, and disposal habits remain unchanged, this waste is projected to more than double to 120 million tonnes per year by 2050.

Design Framework

5D design

process

The 5D framework, Discover, Describe, Determine, Develop, Deliver, gave structure to a problem space that is vast, non-linear, and easy to get lost in. Each phase had a clear output that fed the next, turning open-ended research into a focused design intervention. For systems thinking work, that kind of staged discipline isn't a constraint, it's what makes the complexity navigable.

The 5D framework, Discover, Describe, Determine, Develop, Deliver, gave structure to a problem space that is vast, non-linear, and easy to get lost in. Each phase had a clear output that fed the next, turning open-ended research into a focused design intervention. For systems thinking work, that kind of staged discipline isn't a constraint, it's what makes the complexity navigable.

  1. Discover

Introduction

  • Identifying the area

  • Understanding area

  1. Describe

Systems thinking

  • Area briefing

  • Research insights

  • Brainstorming

Systems mapping

  • Sequence mapping

  • Stakeholder mapping

  • Causal loop diagram

  • Unfolding the systems

Systems understanding

  • Social impact

  • Environmental impact

  • Economical impact

  1. Determine

Potential areas to work

  • Opportunity mapping

  • Identifying the potential areas

Target area

  • Target area: why & how?

  • Understanding the focus area

  • Understanding the end users

  • Validating the hypothesis

  1. Develop

Communication strategies

  • What, how & why?

  • Current practices

  • Identifying the challenges

Design brief

  • Design brief

  • Demographics

  1. Deliver

Proposed solutions

  • Persona: challenges & goals

  • Communication strategies

  • Planning & execution

  • Future scope of the project

Discover

Identifying & understanding

problem area

Introduction

Improper e-waste disposal through burning or dumping poses severe risks to human health and the environment, directly hindering the UN’s Sustainable Development Goals.

Improper e-waste disposal through burning or dumping poses severe risks to human health and the environment, directly hindering the UN’s Sustainable Development Goals.

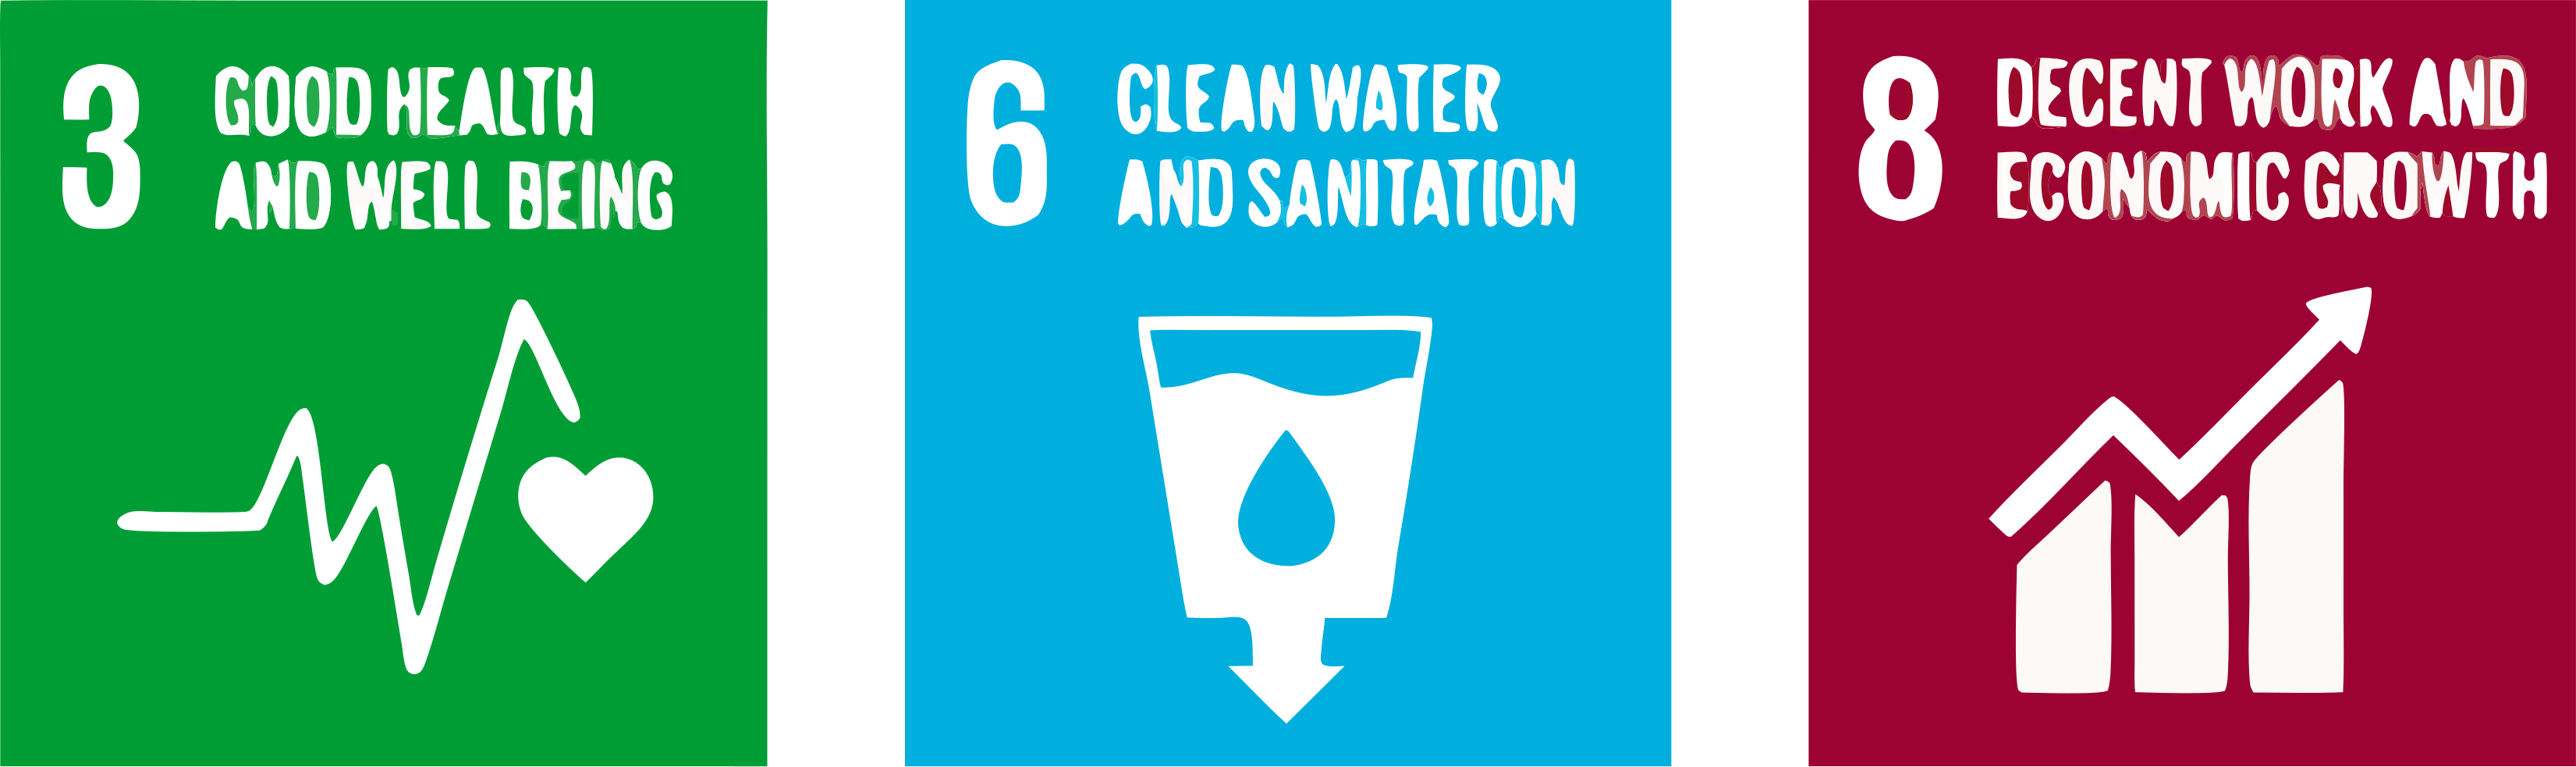
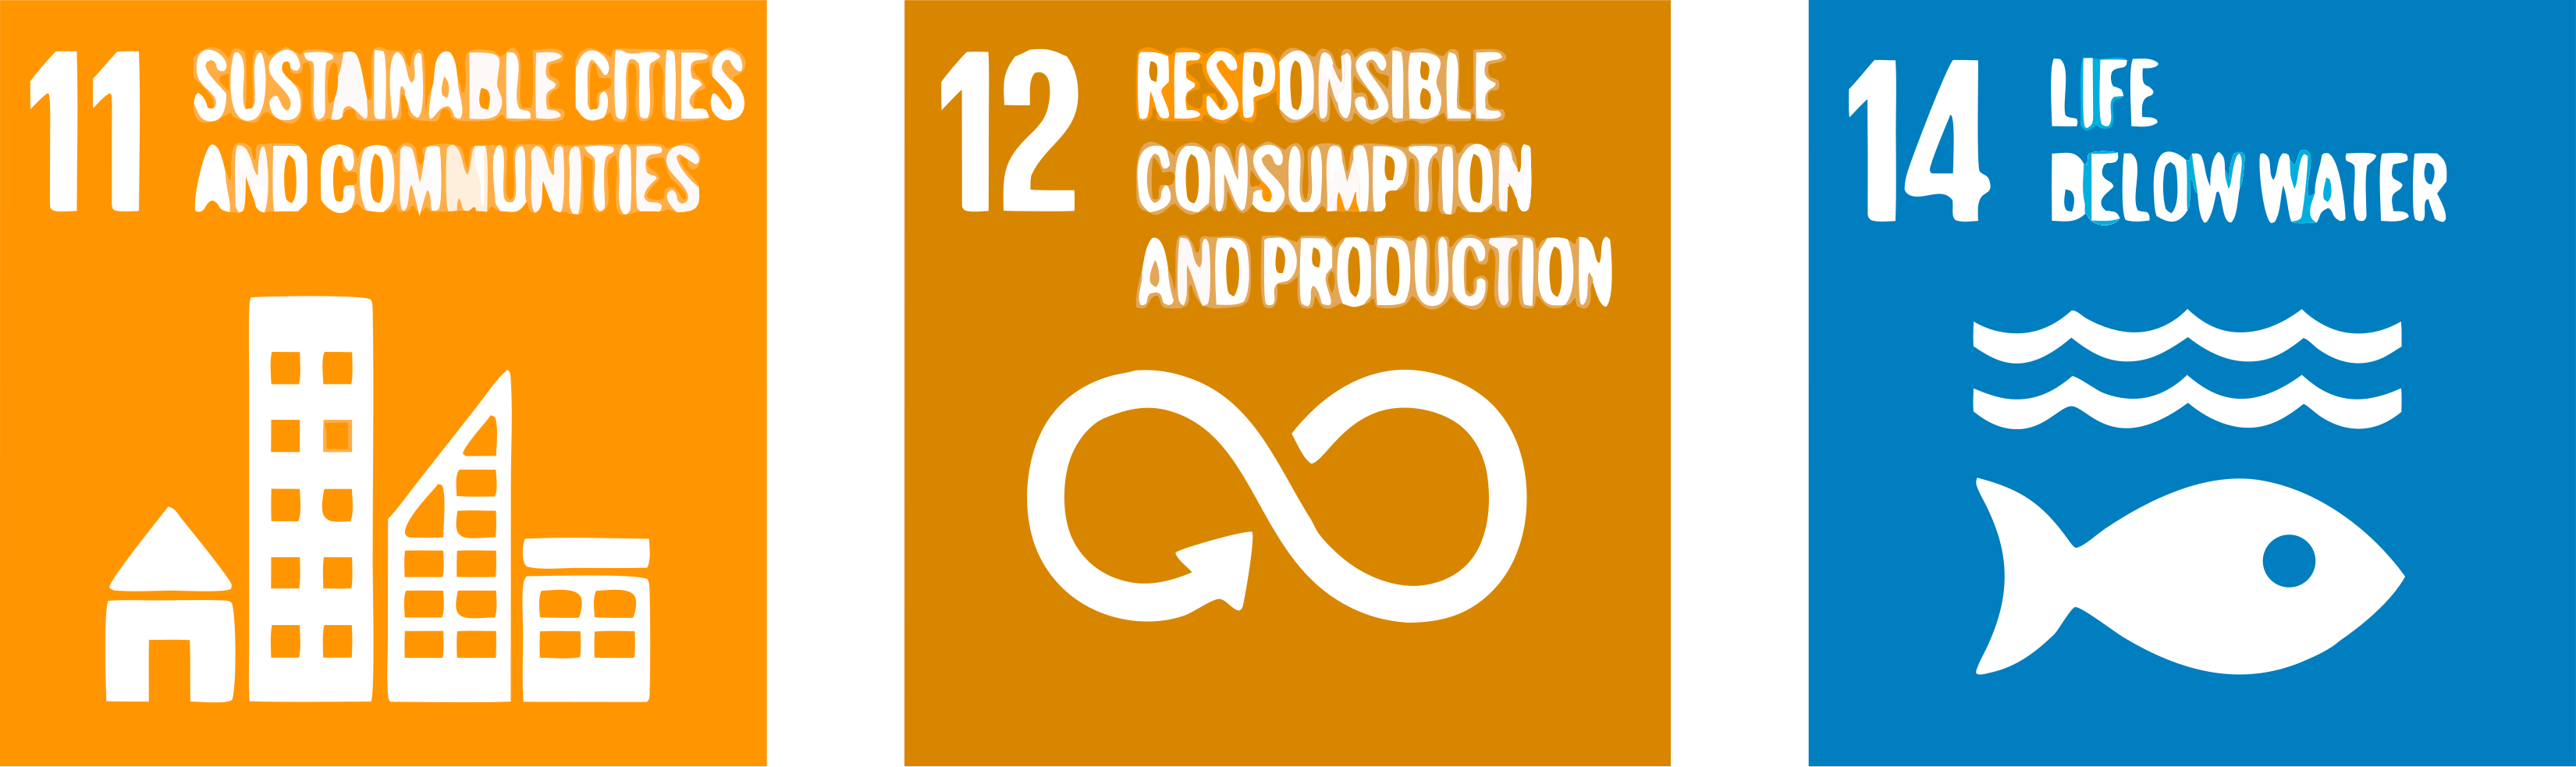
To combat this, better data and insights on e-waste are critical. Improved tracking helps protect health and the environment (SDGs 3, 6, 11, 12, and 14), while waste management unlocks new opportunities for employment and entrepreneurship (SDG 8).

To combat this, better data and insights on e-waste are critical. Improved tracking helps protect health and the environment (SDGs 3, 6, 11, 12, and 14), while waste management unlocks new opportunities for employment and entrepreneurship (SDG 8).

What are E-Products?

Electrical and electronic products are defined as any household or business item with circuitry, or electrical components with power or battery supply. Categories of Electrical and Electronic Equipments:

Electrical and electronic products are defined as any household or business item with circuitry, or electrical components with power or battery supply. Categories of Electrical and Electronic Equipments:

What is E-Waste?

Electronic waste (e-waste) refers to all discarded electronic products and parts not intended for reuse. Because this waste stream contains toxic substances, such as lead, mercury, PCBs, and CFCs, it requires specialized treatment and cannot be safely dumped in landfills.

Electronic waste (e-waste) refers to all discarded electronic products and parts not intended for reuse. Because this waste stream contains toxic substances, such as lead, mercury, PCBs, and CFCs, it requires specialized treatment and cannot be safely dumped in landfills.

However, alongside these hazardous risks, e-waste also contains highly valuable materials like gold, silver, copper, and plastics that can be recovered through proper recycling.

However, alongside these hazardous risks, e-waste also contains highly valuable materials like gold, silver, copper, and plastics that can be recovered through proper recycling.

Composition Analysis
Major Contents of E-Waste
60%15%12%Total100%
Metals
60%
Plastics
15%
CRT & LCD Monitors
12%
Metal Plastics Mixture
5%
Pollutants
3%
Cables
2%
Printed Circuit Board
2%
Others
1%

Generation of E-Waste

E-waste is a unique category of waste. Along with hazardous materials, it also contains precious substances like silver, gold, platinum, palladium, nickel and copper. For this reason, we do not see e-waste lying around on the streets or in the common bins of our cities and villages. E-waste handling is lucrative business, attracting the informal as well as the formal sector.

E-waste is a unique category of waste. Along with hazardous materials, it also contains precious substances like silver, gold, platinum, palladium, nickel and copper. For this reason, we do not see e-waste lying around on the streets or in the common bins of our cities and villages. E-waste handling is lucrative business, attracting the informal as well as the formal sector.

Higher level of disposable incomes

Higher consumption rate of E-products

Shorter product lifecycle

Urbanization

Industrialization

Less repair options

Technical growth

Major cause of E-waste generation

Management of E-Waste

Informal sector

Despite over seven years of formal regulation, nearly 90% of India's e-waste is still handled by the informal sector. It keeps vast volumes out of landfills and sustains millions of livelihoods, but the environmental and health costs of non-scientific dismantling remain unaddressed.

Despite over seven years of formal regulation, nearly 90% of India's e-waste is still handled by the informal sector. It keeps vast volumes out of landfills and sustains millions of livelihoods, but the environmental and health costs of non-scientific dismantling remain unaddressed.

Kabadi Shop

Scrap Dealers

Recyclers

Kabadiwala

Refurbishers

Dismantlers

Formal sector

The formal sector, comprising government-approved Producer Responsibility Organisations, authorised recyclers, and certified dismantlers, is designed to process e-waste scientifically, without environmental harm. In India, it handles only 10% of what is actually generated.

The formal sector, comprising government-approved Producer Responsibility Organisations, authorised recyclers, and certified dismantlers, is designed to process e-waste scientifically, without environmental harm. In India, it handles only 10% of what is actually generated.

Bulk Consumers

Industries

Government

Retail Consumers

Refurbishers

Recyclers

Dealers

OEMs

Retail

Dismantlers

Why informal sector exists?

Unregulated

Money making

Cheap Labor:

Child & Women
Access to

waste & flexibility

Strong Network of Informal Sector

Valuable Materials

Inside E-waste
Lack of Industrial

Recycling Infra

Livelihood

Lack of Awareness Among Consumers

Informal Sector Recycling Process
How ~90% of India's e-waste is processed
CollectionManual Part SeparationDismantling by DamageResale & ReuseMaterial SeparationMetalsPlasticsPCBsOthersPrecious Metal RecoveryIncineration & Acid LeachingSmeltingInto Manufacturing

Why formal sector exists?

Sensitize People

About the Problem

Efficient Material

Recovery

Reduce

Health Hazard

Partnering with informal sector

Scientific Processing

Encourage

Entrepreneurship
Develop Recycling

Infrastructure

Ban Illegal

E-waste Import

Formal Sector Recycling Process
How ~10% of India's e-waste is scientifically processed
CollectionSkilled Part SeparationData Recovery / WipingDismantling by DamageResale & ReuseRemove Hazards & ToxinsShreddingMaterial SeparationMetalsPlasticsPCBsOthersPrecious Metal RecoveryIncineration & Acid LeachingSmeltingInto Manufacturing

Factors affecting E-waste

Material Mining

Growing demand for electronics is increasing pressure on raw material supplies. Recycling metals uses 2–10× less energy and generates 80% lower CO₂ emissions compared to mining virgin ores.

Growing demand for electronics is increasing pressure on raw material supplies. Recycling metals uses 2–10× less energy and generates 80% lower CO₂ emissions compared to mining virgin ores.

Lithium-ion Batteries

The lithium-ion battery market is expected to reach $150 billion by 2030, driven by smartphones and EVs. Battery demand will grow rapidly, with annual sales projected to reach 8 million tonnes, while recycling rates remain low at 42%.

The lithium-ion battery market is expected to reach $150 billion by 2030, driven by smartphones and EVs. Battery demand will grow rapidly, with annual sales projected to reach 8 million tonnes, while recycling rates remain low at 42%.

Informal sector

Rising demand for low-cost electronics has fueled the counterfeit market. Counterfeiting causes significant economic losses, with fake electronic components becoming increasingly common due to affordability and limited consumer awareness.

Rising demand for low-cost electronics has fueled the counterfeit market. Counterfeiting causes significant economic losses, with fake electronic components becoming increasingly common due to affordability and limited consumer awareness.

Policies of E-waste

  • E-Waste Rules, 2011 came into effect on 1 May 2012 under the Environmental Protection Act, 1986.

  • Ensured safe handling, storage, transportation, and recycling of e-waste.

  • E-Waste (Management) Rules, 2016 replaced the 2011 Rules on 1 October 2016.

  • Expanded coverage to manufacturers, dealers, refurbishers, and PROs.

  • PROs help collect and channel e-waste for responsible recycling and disposal.

  • Promotes environmentally sound e-waste management in India.

  • E-Waste Rules, 2011 came into effect on 1 May 2012 under the Environmental Protection Act, 1986.

  • Ensured safe handling, storage, transportation, and recycling of e-waste.

  • E-Waste (Management) Rules, 2016 replaced the 2011 Rules on 1 October 2016.

  • Expanded coverage to manufacturers, dealers, refurbishers, and PROs.

  • PROs help collect and channel e-waste for responsible recycling and disposal.

  • Promotes environmentally sound e-waste management in India.

Research insights

In 2019, the world generated a striking 53.6 Mt of e-waste, an average of 7.3 kg per capita. India generated 3.2 million metric tonnes (Mt) of e-waste in 2019. 

In 2019, the world generated a striking 53.6 Mt of e-waste, an average of 7.3 kg per capita. India generated 3.2 million metric tonnes (Mt) of e-waste in 2019. 

Third largest e-waste generator after the top two countries China (10.1 Mt) and the USA (6.9 Mt), though its per-capita contribution (2.4 kg) to the hazardous waste is much below the global average (7.3 kg). 

Third largest e-waste generator after the top two countries China (10.1 Mt) and the USA (6.9 Mt), though its per-capita contribution (2.4 kg) to the hazardous waste is much below the global average (7.3 kg). 

Current rate of e-waste generation in India is 4.56 times greater than the annual e-waste processing capacity offered by the nation. Low Recycling capacity with only 312 Authorized Recyclers (8 lakh tons annually).

Current rate of e-waste generation in India is 4.56 times greater than the annual e-waste processing capacity offered by the nation. Low Recycling capacity with only 312 Authorized Recyclers (8 lakh tons annually).

E-Waste by State
% contribution to India's annual e-waste generation
Tap a state
% Share
10%+
7–10%
5–7%
3–5%
2–3%
1–2%
< 1%
Top Generators
Maharashtra13.1%
Delhi9.5%
Tamil Nadu9.3%
Karnataka8.9%
Uttar Pradesh7.6%

Scale of the problem

How much

electronic waste

do we generate

every year?

How much

electronic waste

do we generate

every year?

We in India generate around, 3.2 million tons

of electronic waste every year

that is equivalent to 1000+ Statue of Unity.

We in India generate around, 3.2 million tons of electronic waste every year that is equivalent to

1000+ Statue of Unity.

Describe

Systems thinking

and mapping

Sequence mapping

Sequence mapping traces the complete journey of an electronic product, from raw material extraction to end-of-life disposal, making every actor, handoff, and exit point visible in a single view. For e-waste, it revealed that the formal product lifecycle and the informal recycling economy are not separate systems but one connected sequence, and that most of the problem lives in the gaps between them.

Sequence mapping traces the complete journey of an electronic product, from raw material extraction to end-of-life disposal, making every actor, handoff, and exit point visible in a single view. For e-waste, it revealed that the formal product lifecycle and the informal recycling economy are not separate systems but one connected sequence, and that most of the problem lives in the gaps between them.

Sequence Mapping
Comparative tracking of e-waste pipelines vs. formal device lifecycles
E-Waste Flow System
Product Lifecycle Path
EXTRACTIONPROCESSINGTRANSPORTMANUFACTURINGDISTRIBUTIONRETAILUSEEND OF LIFERECOVERYOUTCOMEE-WASTELIFECYCLEMaterialExtractionRefinementTransportationManufacturingTransportation /Import-ExportWarehousing &DistributorConsumer UseEnd of LifeKabadiwala &Informal SectorLandfills /WasteRaw MaterialExtractionRaw MaterialProcessingManufacturingPackagingTransportationProduct UseEnd ofProduct UseRecycleDesign &DevelopmentRefurbish &ReuseExportImportedDeviceDeadStorageRepair /RefurbishDomesticWasteFormal SectorRecyclingImportedE-Waste
Hover any structural system node to inspect tracking metrics
Primary Pipeline
Mitigation / Recovery
Hazard & EOL Risks
Intervention Channels

Stakeholder Mapping

Stakeholder mapping identified every actor in the Indian e-waste ecosystem, from global policy bodies and national regulators down to kabadiwala networks, product designers, and individual consumers, and made visible how their interests, responsibilities, and incentives relate to one another. The exercise revealed that the system's dysfunction is not the result of any single actor failing, but of misaligned incentives across all four layers simultaneously.

Stakeholder mapping identified every actor in the Indian e-waste ecosystem, from global policy bodies and national regulators down to kabadiwala networks, product designers, and individual consumers, and made visible how their interests, responsibilities, and incentives relate to one another. The exercise revealed that the system's dysfunction is not the result of any single actor failing, but of misaligned incentives across all four layers simultaneously.

Institutional Stakeholder Architecture
Nested oversight layer alignment from macro global rules down to execution channels
GLOBAL SYSTEM LAYERSE-waste CoalitionWorld Economic ForumWorld Business Council for Sustainable DevelopmentDeutsche Gesellschaft für Internationale Zusammenarbeit (GIZ)NATIONAL FRAMEWORKSCentral GovernmentMinistry of Environment, Forest and Climate ChangeMinistry of Electronics and Information Technology (MeitY)Central Pollution Control BoardConsumer Electronics and Appliances Manufacturers Association (CEAMA)Human Rights OrganizationsAssociated Chambers of Commerce and Industry of India (ASSOCHAM)STATE & INDUSTRY OPERATORSState Pollution Control BoardOriginal Equipment Manufacturer (OEM)Orphaned Goods ManufacturerLOCAL IMPLEMENTATION CHANNELSProducer Responsibility Organizations (PRO)Non-Governmental Organization (NGO)Municipal CorporationsDealers & DistributersProduct DesignersGarbage CollectorsRefurbishersInsurance CompaniesRetailersRetail ConsumersBulk Consumers
Hover any layout stakeholder entity line above to track system definitions.

Causal Loop Diagram

The causal loop diagram mapped the feedback loops sustaining India's e-waste crisis, showing how informal sector economics, consumer behaviour, policy gaps, and industry incentives reinforce each other in cycles that no single intervention can break. It made visible what systems analysis always reveals: that the problem is not a chain of causes but a web of them, where pulling one thread tightens several others.

The causal loop diagram mapped the feedback loops sustaining India's e-waste crisis, showing how informal sector economics, consumer behaviour, policy gaps, and industry incentives reinforce each other in cycles that no single intervention can break. It made visible what systems analysis always reveals: that the problem is not a chain of causes but a web of them, where pulling one thread tightens several others.

Causal Loop Ecosystem
System feedback loops driving and sustaining systemic electronic waste variables
CORE VECTORENVIRONMENTAL IMPACTINDUSTRY FORCESINFORMAL SECTORHEALTH IMPACTFORMAL SYSTEMHUMAN BEHAVIOURSOCIAL CONTEXTE-WasteManufacturingTechnologicalGrowthAdvertisementDesign forEoL & RepairVirgin MaterialDemandEarth MiningSoil, Water &Air PollutionLandfillResourceScarcityClimateChangeInformalRecyclingChildLabourUnskilledLabourLifeDegradationToxicExposureEPR & GovPoliciesAuthorisedRecyclerUrbanMiningGDPGadgetsper PersonLow PriceProductsFrequent DeviceReplacementDeadStorageGadgetDemandEmotionalAttachmentBetterLifeIllegalExportReinforcing Impact (+)Balancing Impact (−)System Delay Link

Social Impact

E-waste contains highly toxic substances like lead, mercury, chromium, and cadmium that contaminate water sources and food supply chains when improperly handled.
While extracting these valuable components provides vital income for the informal sector in developing countries, primitive recycling methods—such as burning plastics, melting lead in open pots, or using acid baths—dangerously expose workers and their families to severe health hazards.

E-waste contains highly toxic substances like lead, mercury, chromium, and cadmium that contaminate water sources and food supply chains when improperly handled.
While extracting these valuable components provides vital income for the informal sector in developing countries, primitive recycling methods—such as burning plastics, melting lead in open pots, or using acid baths—dangerously expose workers and their families to severe health hazards.

Hazardous Components in E-Waste & Their Harmful Effects

Environmental Impact

Electronic waste damages the environment through three main sources: hazardous elements within the equipment, auxiliary substances used during recycling, and toxic byproducts generated during processing.
Informal practices, such as open dismantling, shredding, burning, leaching, and uncontrolled dumping, directly threaten workers while contaminating soil, groundwater, surface water, and air.

Electronic waste damages the environment through three main sources: hazardous elements within the equipment, auxiliary substances used during recycling, and toxic byproducts generated during processing.
Informal practices, such as open dismantling, shredding, burning, leaching, and uncontrolled dumping, directly threaten workers while contaminating soil, groundwater, surface water, and air.

Types of emissions and pathways of pollutants
Informal e-waste recycling — tap any element to explore
AIRBIOTA / SOILWATERGROUNDWATERSURFACE WATERSEDIMENTSE-waste entering unsound recycling treatmentsmsmsmwwUncontrolled dumpingopen dumps, landfillDismantling / shreddingmanual breakdownPyrolysis / burningopen burning, incinerationHydrolysis / leachingacid baths, wet processesmaterial transportbetween treatmentssubject to long-distance transportparticles in air →By-productsrecovered materialsOriginal substancesheavy metals, POPs, etc.Auxiliarysubstances
Leachates
Coarse particles
Fire particles
Fly ashes
Fumes
Effluents
Wastewater
Solid materials
Tap any process, emission dot, or substance to learn more
coloured dots = emission types · dashed arrows = transport pathways

Economical Impact

The world's most valuable material deposits are sitting in landfills and homes, not underground. A ton of smartphones contains 100 times more gold than a ton of traditional gold ore. E-waste yields up to 350g of gold per tonne, while traditional mines produce just 5–6g. Extracting raw materials from natural ore is 13 times more expensive than urban e-waste mining. Recycling electronics is no longer just an environmental choice, it is an economic necessity.

The world's most valuable material deposits are sitting in landfills and homes, not underground. A ton of smartphones contains 100 times more gold than a ton of traditional gold ore. E-waste yields up to 350g of gold per tonne, while traditional mines produce just 5–6g. Extracting raw materials from natural ore is 13 times more expensive than urban e-waste mining. Recycling electronics is no longer just an environmental choice, it is an economic necessity.

Precious metals & other

material stuck in waste
Higher cost of raw materials

extracted from mining

Loss of employment

opportunity

Additional cost of

managing E-waste

Guided by Mr. Balaji Rengarajan

Guided by Mr. Balaji Rengarajan

·

Systems thinking 2022

Systems thinking 2022

·

NID Bengaluru

NID Bengaluru

Thank you

Thank you

for the scroll.

for the scroll.

Liked my portfolio!

Wanna

work

together?

Liked my portfolio!

Wanna

work

together?

Feel free to reach out,

+91 9453 558721

|

krishnan.lalitya@gmail.com

|

Designed with

By Lalitya Krishnan

|

© 2026 All rights reserved

Feel free to reach out,

+91 9453 558721

krishnan.lalitya@gmail.com

Designed with

By Lalitya Krishnan

© 2026 All rights reserved